자바스크립트 따라하기 – YTTrendchart (기본)
페이지 스크립트에서 YTTrendchart 객체를 활용할 수 있습니다.
1. 뷰어로 샘플 실행하기
|
|
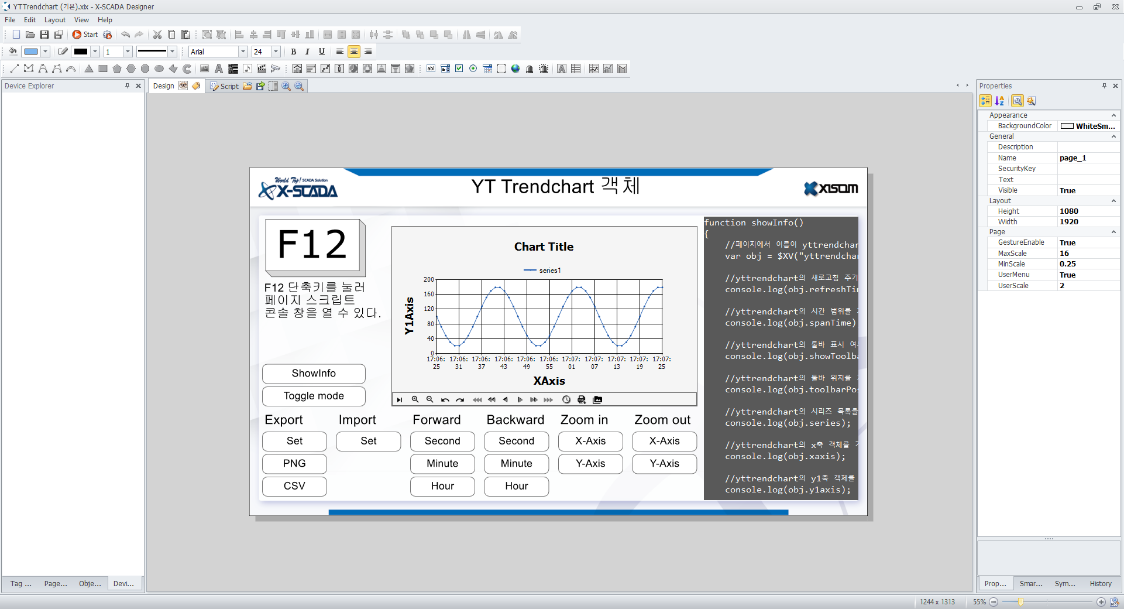
(객체를 생성할 때는 도구를 클릭하고 마우스 커서를 Design 영역으로 옮겼을 때 커서가 십자 표시로 되면 생성할 위치에 클릭한 상태로 드래그하면 된다.)
|

1) 디자이너에서 F5키를 누르거나 실행 버튼을 눌러 뷰어를 실행한다.
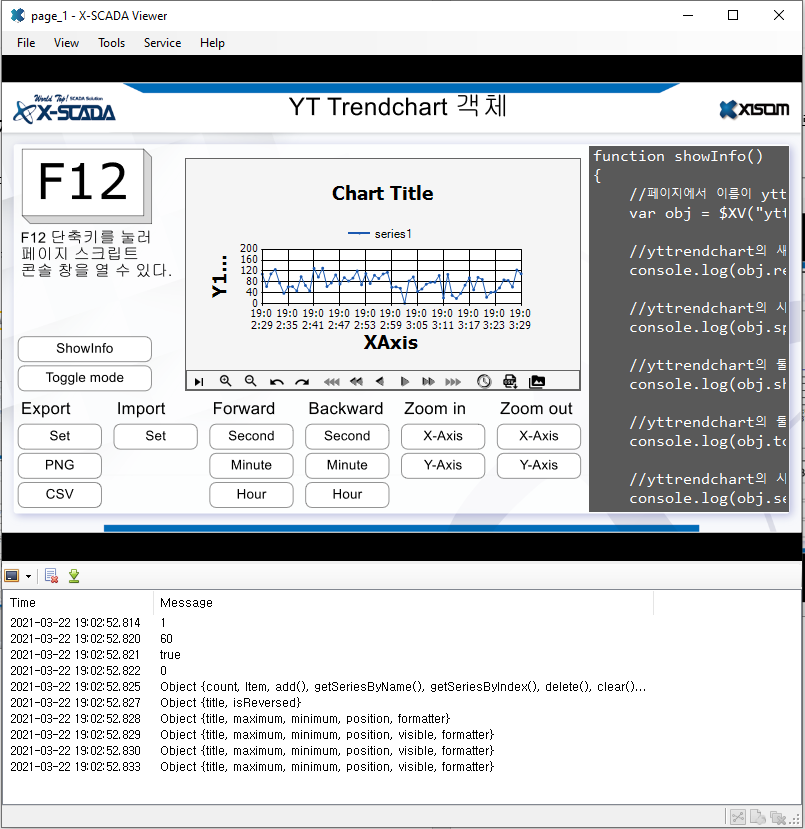
2) Print 버튼들을 눌러 콘솔 로그를 남길 수 있다(콘솔 로그는 F12 키를 눌러 확인한다).
2. 스크립트 코드 해석
1) page_1 페이지
① showInfo 메소드
|
function showInfo() { var obj = $XV("yttrendchart_1");
console.log(obj.refreshTime);
console.log(obj.spanTime);
console.log(obj.showToolbar);
console.log(obj.toolbarPosition); . console.log(obj.series);
console.log(obj.xaxis);
console.log(obj.y1axis);
console.log(obj.y2axis);
console.log(obj.y3axis);
console.log(obj.y4axis); } |
(1) var obj = $XV("yttrendchart_1");
이름이 yttrendchart_1인 뷰 객체를 가져와 obj 변수에 저장한다.
l 페이지 콘솔 창 결과: -
(2) console.log(obj.refreshTime);
yttrendchart의 새로고침 주기를 가져온다.
l 페이지 콘솔 창 결과: 1 (1초)
(3) console.log(obj.spanTime);
yttrendchart의 시간 범위를 가져온다.
l 페이지 콘솔 창 결과: 60 (60초)
(4) console.log(obj.showToolbar);
yttrendchart의 툴바 표시 여부를 가져온다.
l 페이지 콘솔 창 결과: true
(5) console.log(obj.toolbarPosition);
yttrendchart의 툴바 위치를 가져온다.
l 페이지 콘솔 창 결과: 0 (Default)
(6) console.log(obj.series);
yttrendchart의 시리즈 목록을 가져온다.
l 페이지 콘솔 창 결과: {count, Item, add(), getSeriesByName(), …}
(7) console.log(obj.xaxis);
yttrendchart의 x축 객체를 가져온다.
l 페이지 콘솔 창 결과: Object {title, isReversed}
(8) console.log(obj.y1axis);
yttrendchart의 y1축 객체를 가져온다.
l 페이지 콘솔 창 결과: Object {title, maximum, minimum, position, formatter}
(9) console.log(obj.y2axis);
yttrendchart의 y2축 객체를 가져온다.
l 페이지 콘솔 창 결과: Object {title, maximum, minimum, position, visible, formatter}
(10) console.log(obj.y3axis);
yttrendchart의 y3축 객체를 가져온다.
l 페이지 콘솔 창 결과: Object {title, maximum, minimum, position, visible, formatter}
(11) console.log(obj.y4axis);
yttrendchart의 y4축 객체를 가져온다.
l 페이지 콘솔 창 결과: Object {title, maximum, minimum, position, visible, formatter}
② switchMode 메소드
|
function switchMode() { $XV("yttrendchart_1").isLivePress(); } |
(1) $XV("yttrendchart_1").isLivePress();
yttrendchart의 동작 모드를 변경한다. (실시간 <-> 히스토리)
l 페이지 콘솔 창 결과: -
① yZoomIn 메소드
|
function yZoomIn() { $XV("yttrendchart_1").yZoomIn(50); } |
(2) $XV("yttrendchart_1").yZoomIn(50);
yttrendchart의 y축을 50% 확대한다.
l 페이지 콘솔 창 결과: -
② yZoomOut 메소드
|
function yZoomOut() { $XV("yttrendchart_1").yZoomOut(100); } |
(3) $XV("yttrendchart_1").yZoomOut(100);
yttrendchart의 y축을 100% 축소한다.
l 페이지 콘솔 창 결과: -
③ xZoomIn 메소드
|
function xZoomIn() { $XV("yttrendchart_1").xZoomIn(); } |
(4) $XV("yttrendchart_1").xZoomIn();
yttrendchart의 x축을 확대한다.
l 페이지 콘솔 창 결과: -
④ xZoomOut 메소드
|
function xZoomOut() { $XV("yttrendchart_1").xZoomOut(); } |
(5) $XV("yttrendchart_1").xZoomOut();
yttrendchart의 y축을 축소한다.
l 페이지 콘솔 창 결과: -
⑤ backwardHour 메소드
|
function backward |
